FunFrame: A functional gene ecological analysis pipeline
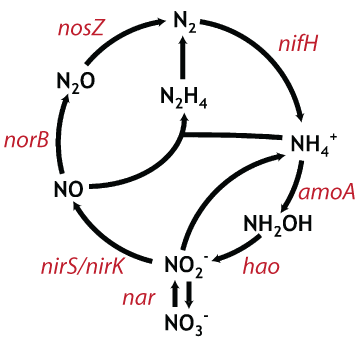 |
| Fig 1. representative genes encoding critical enzymes in the nitrogen cycle. Figure modified from Jetten et al. (2008). |
Advances in next generation sequencing have revolutionized what we know about microbial community structure in a wide variety of environments. Most frequently researchers target the small subunit of the ribosomal RNA gene to examine the distribution of microbes in the environment. While valuable, examination of the 16S rRNA gene can rarely be used to infer microbial function. Metagenomics and transcriptomics of whole microbial DNA and RNA go further toward assessing function, but often times the depth of sequencing required to determine statistically meaningful patterns is prohibitive. A third approach, functional gene pyrosequencing (FGP) is gaining in popularity because it allows researchers the opportunity to probe deeply into the diversity and distribution of genes that encode specific proteins.
Our lab is interested in questions regarding the role of increasing supplies of anthropogenic nitrogen in coastal and estuarine waters. Since we are particularly interested in processes that transform, and eventually remove, nitrogen from these environments, we wanted a way to look specifically at some of the key genes that underlie critical steps in the nitrogen cycle (Fig. 1). Due to the vast abundance and diversity of microbes in these highly enriched systems, however, whole system metagenomic approaches would be cost prohibitive. Instead, we have developed a pipeline for the analysis of functional gene pyrosequencing data so that we can probe deeply into the distribution and diversity of various genes involved in nitrogen cycle. Combining these analyses with manipulative experiments will allow us to begin to understand what environmental parameters control these processes at a molecular level.
Computational methods for the analysis of functional gene amplicons has lagged behind the development of methods for the analysis of 16s rRNA genes and whole community metagenomics. Protein coding gene sequences, however, are fundamentally different from their non-coding 16S rDNA counterparts because the genetic code is constrained to the 61 amino acid triplets. Thus, if a sequence has an unexpected stop codon in the middle of the gene it can be assumed that this results from sequencing error and the sequence can be removed. Thus far, this stop codon approach is the primary mechanism for detecting and removing sequencing artifacts from pyrosequencing runs. Due to the nature of the sequencing errors that arise as a result of pyrosequencing, a more nuanced approach can be used to correct sequencing errors and retain additional sequences. It is well established that pyrosequencing of homopolymer regions of DNA is prone to errors, as the systems have difficulty resolving the number of bases being added. A recently developed algorithm, HMM-FRAME, allows for the identification and correction of frameshift errors that result from pyrosequencing by comparing sequences to a hidden Markov model of the target protein. Taking advantage of this clever algorithm, my colleague David Weisman and I developed a complete pipeline for the analysis of protein coding genes. Our pipeline includes steps to identify and correct homopolymer errors, to remove chimeras that might have been formed during the PCR reaction, and it uses the R statistical language to calculate rarefaction curves and diversity metrics as well as perform cluster and ordination analysis on UniFrac and Bray Curtis similarity metrics. A full overview of the workflow for FunFrame can be found here.
We tested our bioinformatics pipeline against several control sequences to assess rates of error inflation. In our recently published paper in Bioinformatics, we show that our pipeline both retains more sequences and has lower error rates than the stop codon approach:
Clone identification |
||||
P. aeruginosa |
SHC2C |
SHCSF |
SK209235 |
|
Before pipeline:
|
||||
| Total number of sequences | 9084 |
5780 |
11,382 |
14,494 |
| Number of exact matches | 5057 |
1618 |
5496 |
6077 |
| Calculated error rate | 44.3% |
72.0% |
51.7% |
58.1% |
After FunFrame pipeline:
|
<||||
| Sequences removed | 7 |
320 |
710 |
70 |
| Remaining sequence numbers | 9077 |
5460 |
10,672 |
14,424 |
| Number of exact matches | 8958 |
5456 |
10,670 |
14,424 |
| Number of OTUs | 9 |
3 |
3 |
1 |
| Calculated error rate | 0.18% |
0.073% |
0.019% |
0.00% |
After stop-codon removal:
|
||||
| Sequences removed | 110 |
3889 |
238 |
1771 |
| Remaining sequence numbers | 8974 |
1891 |
11,144 |
12,723 |
| Number of exact matches | 8847 |
1887 |
11,142 |
12,271 |
| Number of OTUs | 11 |
4 |
3 |
2 |
| Calculated error rate | 1.4% |
0.21% |
0.017% |
0.016% |
We then applied our entire pipeline in the analysis of the nirS gene, a key gene in the denitrification pathway (Fig. 1), from the sediments of the experimental fertilization plots at Great Sippewissett Salt Marsh. We also modified our pipeline to remove the HMM-FRAME correction (making it equivalent to the stop codon approach), and compared rarefaction curves produced from the different analyses (Fig. 2).
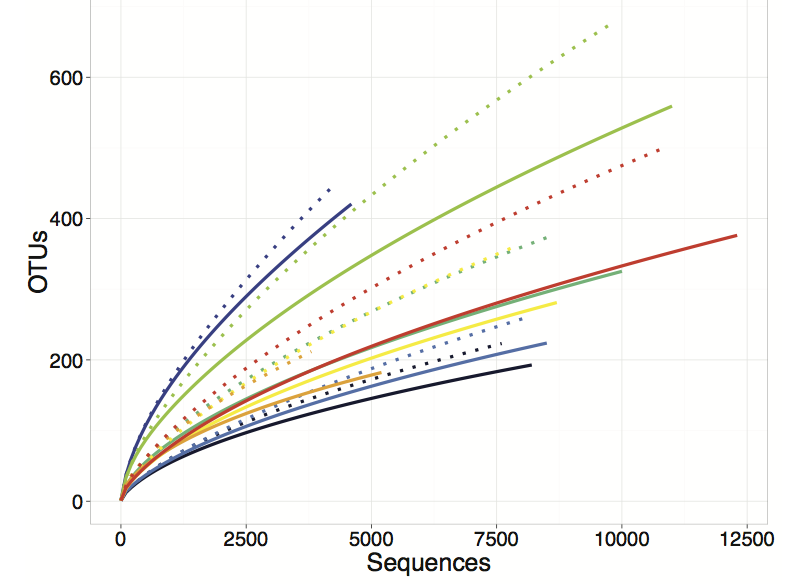 |
| Figure 2: Rarefaction curves based on FunFrame compared to stop codon filtering of different samples from different salt marsh plots. Solid and dotted lines produced by FunFrame and stop codon filtering, respectively. FunFrame retains more sequences and produces less OTU inflation. |
FunFrame (Fig 2, solid lines) retains more sequences than the stop codon filtering (Fig. 2, dashed lines) approach (indicated by the solid lines extending further along the x-axis than the stop codon analysis). More importantly, FunFrame produces lower spurious diversity (demonstrated by the solid lines falling lower on the y-axis than the dashed lines). Thus, although the stop codon approach does detect and remove some spurious sequences, it is not able to correct sequences with obvious homopolymer errors (thus deleting more sequences than necessary) and it does not have a mechanism for filtering out spurious OTUs that may not result in the formation of a stop codon, but that nonetheless are low quality sequences. The result is a bioinformatics pipeline that retains the most data and removes the greatest proportion of spurious sequences. The inflation of diversity that results from the FunFrame analysis is on par with the inflation of diversity that is found in analysis of 16S rRNA gene sequences.
The full FunFrame pipeline can be downloaded by clicking on the links below:
FunFrame Supplemental materials